Overview graph
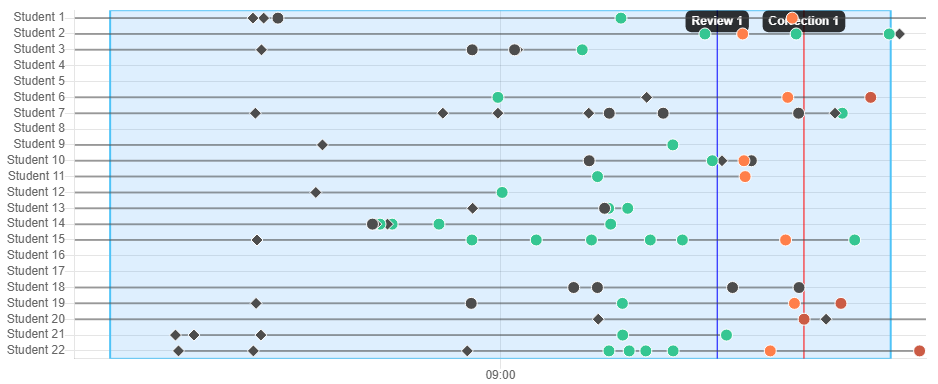
This page lets the teacher follow the work of his students using a graph displaying the commits of each student (on the y axis) according to time (on the abscissa) as well as the sessions of TP, reviews and corrections.
Table of contents
Features
In this graph, student commits are visible. Milestones and sessions are also shown. Each commit is colored according to its type :
- black : the commit is called intermediate and isn’t closing a question
- green : the commit closes a question and is before the associated review
- orange : the commit closes a question and is between the associated review and correction
- red : the commit closes a question and is after the associated correction
Overview graph
The sessions are represented with blue rectangles.
Reviews are blue vertical lines, corrections red vertical lines and others black vertical lines
-
You can hover a commit to see its message and author. If you click on it, the Github page of the commit opens in a new tab
-
You can also click anywhere on the graph to add a milestone, or click on an existing milestone to edit or delete it.
See more about configuring milestone
Filter commits
It is possible to filter the repositories or some of the commits displayed.
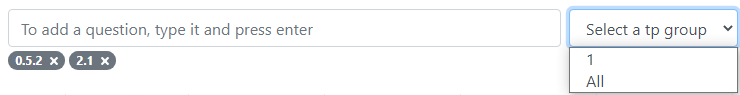
Filtering elements, here only the commits related to questions 0.5.2 and 2.1 are displayed
There are 2 ways to filter data :
- Filter the commits according to the questions you want to see solved with the input in which it is possible to add or delete questions
Only the questions defined in metadata can be selected (see how to configure metadata)
- Filter the repositories as well as the milestones according to a workgroup using the dropdown list on the right. By default, all repositories are displayed and the
Alloption displays all of them
Hide annotations
You can graphically hide milestones and sessions. The commits type will still be affected by the milestone.
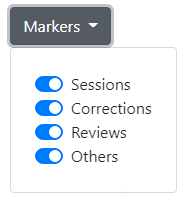
Hiding milestones and sessions, all are displayed here
Utilities and refresh

Some utilities to help with navigation withing the graph and refreshing data from Github button
-
The first button resets the zoom. You can also press the space bar for the same result
- The second button switches between the 2 zoom modes :
- zoom with the mouse cursor
- zoom with the mouse wheel and move with the cursor
- The third button switches between 3 time scales
The time scale adapts in real time with the zoom level
- The last button on the right is for reloading the data from Github