Other graphs
These graphs make it possible to bring out certain information according to the data returned by Github.
Table of contents
Students commits graph
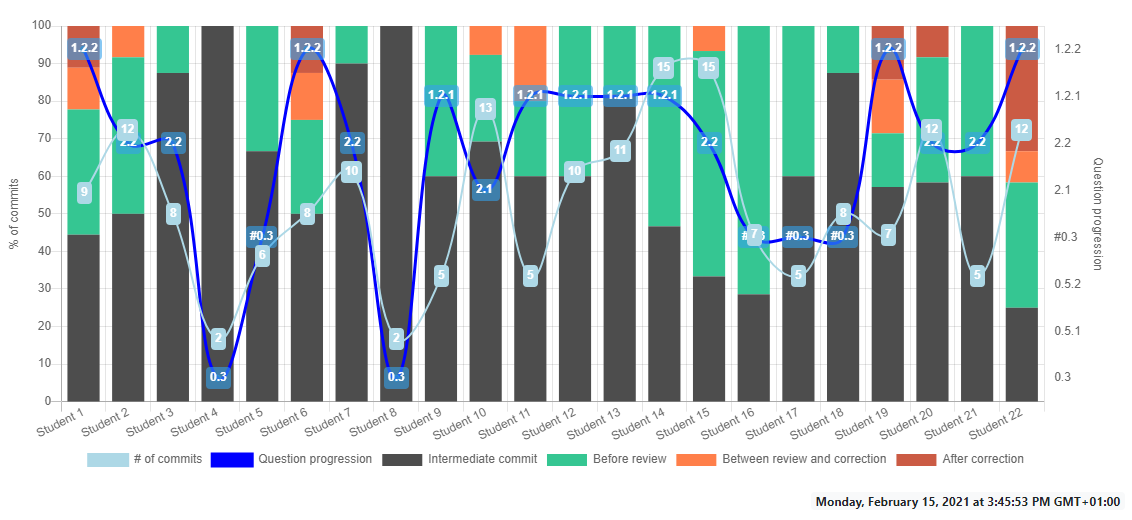
This graph shows the distribution of commit types for each student. This allows, when related to the total number of commits and the progression in the questions, to have an indication of how the student works, and to identify possible difficulties.
The colors correspond to the same meanings as in the overview graph.
There are 2 new elements in the graph:
-
the total commit count of a student, represented by the green curve
-
the last question answered by the student, their progress, as represented by the blue curve
 Students commits graph
 It’s possible to hover each portion (commit type), to see the number of commits of this type.
Questions completion graph
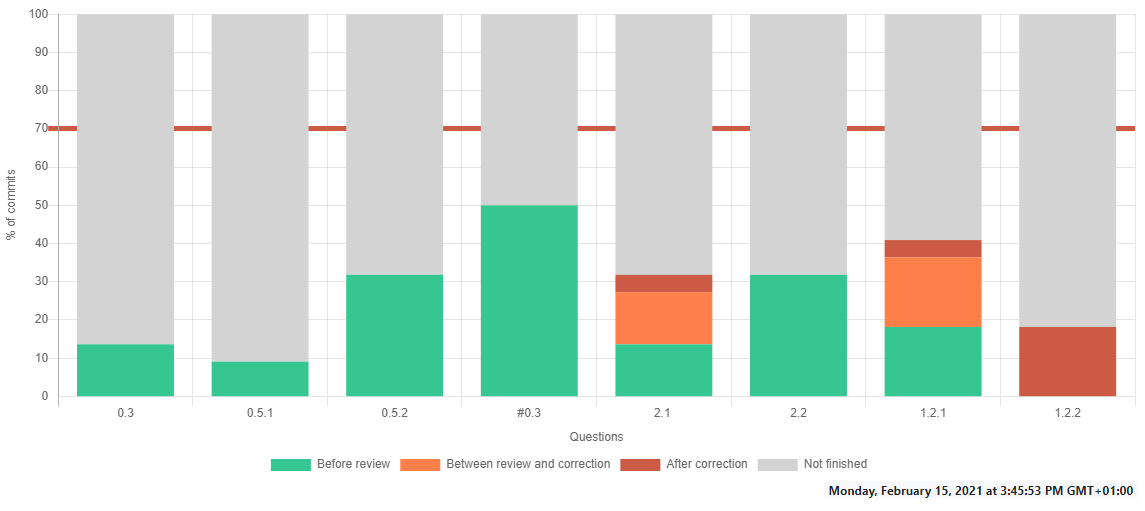
This graph shows the progress of an entire group (or all) on the questions, helping the teacher to plan reviews and corrections at the best possible time. For each question, we see the distribution of the types of its closing commits
Here again, the colors correspond to the same meanings as in the overview graph. But a new color is present, gray, for all the students who did not answer the question.
 Questions completion graph
 The red bar on the graph is a purely graphical element, moveable from 10 to 90. The goal is to have a level at which the teacher knows it is time to start the next questions.
It can be moved 10 by 10 with the bar shown below.

Bar index slider
It is possible to hover a portion to see the list and the number of students in that portion.
Toolbar
Both graphs have a toolbar with most of the elements in common.

Common toolbar for both graphs
-
The first element is used to filter the commits according to a workgroup. By default, all commits are displayed and the
Alloption displays all of them - The second element allows to “travel in time”, to take into account the commits only up to the selected date
- By default, the date of the last commit is selected and it is possible to go back to the date of the first commit
- The last element, the button on the right is for reloading the data from Github
Finally, for both graphs, it is possible to hide the datasets by clicking on them in the legend.

Common toolbar for both graphs